As social media marketers, we have a wealth of tools at our disposal to measure our performance. But with so much to track, what can get lost is focus on the metrics we can dramatically improve with specific tactical decisions. We want to know where we can really move the needle, fast.
When Twitter made a wealth of new Tweet stats available to the public in late 2014, we had just such a number. “We need to increase our Twitter engagement rate,” declared my boss, and my team set about finding the tactics that would impact this important new metric.
Our first step was to examine our historical results. For most of 2014, our average Twitter engagement rate (TER) held steady at 0.5% per Tweet. Was this good? Was this bad? We weren’t sure. What we did know was that we were driving steady traffic to our blog (one of our KPIs) and we were exceeding our conversion targets for Enterprise leads (another one of our KPIs). We also held a strong social share of voice (a third KPI). We were doing well, but there’s always room to get better.
We set a modest goal in October of increasing our TER to 0.7%. By the end of 2014 we had exceeded all expectations and achieved a 1.1% TER. In January we are already up to 1.4% for the month.
What does this all mean? How do you calculate Twitter engagement rate? Essentially, it is a measure of how many people who see your Tweet interact with it. You divide the number of Tweet engagements by the number of impressions to output a ratio out of 100%. The engagements included in the calculation are:
- Link clicks
- Favorites
- Retweets
- Replies
- Embedded media clicks
- Detail expands
- Shared via email
- Permalink clicks
- User profile clicks
- Follows
By this point, you may be rolling your eyes at another vanity metric. You’re not alone. I felt the same at first, too. But what our team discovered is that TER is a directional metric—a performance indicator if you will. If you are increasing your TER, other good things start to happen to your KPIs.
For example, the traffic we were driving to our blog increased by 38% from October to November. We were floored. Moreover, we had shifted our content to focus on our core audience: social media pros. We assumed this would increase our traffic, but we wondered how it would impact other KPIs. What about lead generation? We were reminded that providing our audience value should always be our focus: lead generation increased by 53% from October to November. November is historically a slow month, but it became our top month for social media lead generation in all of 2014.
So what was the secret to our success? I asked Hannah Clark, our lead Tweet crafter, to compile her Top-5 tips for how to increase your TER:
- Understand what your audience WANTS to see in their stream. Hannah says: “We have a lot of social media managers and social media gurus that follow us. They are always looking for new tips, tricks, or hacks to make their lives easier. Practical content works extremely well.”
- Select compelling images to accompany your Tweet. GIFs also perform well, so it can be worth your while to work with your design team to create some GIFs to accompany Tweets.
- Refine your copy over and over again. Tweets are not like a Showtime Rotisserie Grill – you can’t ‘set it and forget it’. Tweets are like children. You need to nurture them over time and keep testing and refining until you get it right.
- Double down on content that works. Tweets and content that perform get published over and over again. Tweets or content that are duds quickly find their way out of the rotation. Feedback is provided to the team that created the content to let them know why we felt that it didn’t perform.
- Show a little personality in your copy. A little bit of sass (funny, not mean) can go a long way in getting people to engage with your Tweet. Remember, you are trying to stand out in a sea of information.
We dug into our archives and pulled five of our favourite Tweets that showed strong TER. Here’s why we feel that each Tweet was successful.
Tweet #1: Content Calendar Graphic (TER: 5.5%)

NOTES: While this image made our design team threaten to take away our keys to Photoshop, it performed extremely well over and over again with a TER in the 5.5% range. One of the common themes that arises up when I talk to my social media counterparts is content calendars. No one seems to have the perfect content calendar, but this screenshot of our content calendar resonated with the audience and its an image we go back to time and time again.
Tweet #2: Your product is a piece of sh#t (TER: 5.3%)

NOTES: Having your CEO read mean Tweets about your product shows the personality of the company. Extending this into both the image and the copy helped this content stand out and drove a TER of 5.3%.
Tweet #3: Social Media Manger Movies (TER: 3.8%)
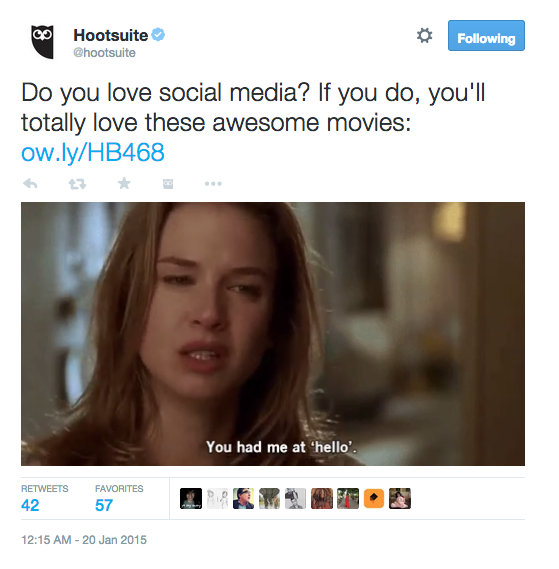
NOTES: The part of this Tweet that works so well is that it plays to the inner curiosity of social media managers. If there’s one thing that social media managers love, it is being the most informed social media manager on the block (and broadcasting it to your peers). So when you see a Tweet telling you that you need to watch movies or TV shows, you’re on it. Add in the pop culture reference in the GIF and you have a match made in heaven: Social Media + Pop Culture Reference + GIF = Win.
Tweet #4: Social Media Glossary – Twitter Canoe (TER: 2.5%)

NOTES: This Tweet works because the content it is providing is extremely helpful. Remember Rule #1: Provide value. We created a glossary of 150+ social media terms with no strings attached. People favourite this Tweet, which signals that they are bookmarking it and will refer to it over and over. The image is also interesting – a custom job created by one of our designers.
Tweet #5: Hashtags (TER 4.8%)

NOTES: The image isn’t super compelling, but it still stands out enough to grab your attention. From there, the copy helps deliver a high TER. The “make sure you aren’t doing X” copy works well because people don’t like to make mistakes. Seriously, who wants to be doing something wrong in a place as public as Twitter? #NotMe You may argue that copy like this could be considered click bait, but allow me to invoke Rule #1 in my defence – there is value at the other end of that link, so everyone walks away better off.
Is TER the be-all-end-all for social media managers? Absolutely not. But it is a performance indicator that you’d best be watching or you’ll be left wondering why your KPIs aren’t living up to expectations.