Analytics. The word even sounds scary. Something about that ‘y’ in the middle.
When you’re learning a new skill or adapting to new techniques and technologies, the last thing you want to focus on are numbers. Reports, charts and graphs can be intimidating, even to the hardened vet—a title that very few people can claim when it comes to social media.
We’re here to show you that analytics aren’t all that scary. In fact, social networks have made a point of ensuring that analytics are simple and digestible for everyone, whether it’s your first day on the job or you’re the CEO.
Twitter analytics are a prime example. Whether you Tweet once a day or 50 times a day, the social network gathers information around your messaging and your audience. It also takes on the hard part—all those difficult calculations— and presents these insights in a comprehensive but understandable way. What you’re left with is a series of numbers that should quickly show you whether you’re succeeding or failing at marketing on Twitter, and how you might improve.
To further soften the analytics blow, we’ve broken down seven different Twitter analytics insights that could drastically improve your Tweets in a very short period of time.
How to access Twitter Analytics
First things first: how does one actually find Twitter Analytics? Analytics have been available to all users since August of 2014 (before that, access was a little more restricted to the big players and savvy users). You can access Twitter Analytics by either clicking on your own face in the top right corner of the Twitter page and choosing Analytics from the drop-down menu, or by simply visiting https://analytics.twitter.com/. Only after your first to the analytics page visit will Twitter start pulling your Tweet data.
When you click the analytics tab, you’ll be taken to a homepage that has seven more tabs at the top. Again, don’t be put-off. Most of the information you’ll need will be found in the first three tabs: Home, Tweets and Audiences. The other tabs can be used as you become more comfortable or launch sophisticated Twitter campaigns of your own.
Impressions over time
‘Impressions’ is one of those stats that isn’t very telling by itself, but helps add context to other metrics. If you earned 250 retweets in only 50 Tweets, that’s great. But what if those same Tweets earned 500,000 impressions? The number of retweets gains new context. The number of impressions are also made more valuable if tracked over time. Twitter has recognized that, of course, and gives you two different views of your impressions in relation to time.
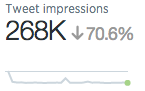
First, you can view a quick snapshot of your impressions on the Analytics home page, right at the top. This number represents your impressions over the last 28 days, but the real value is in the percentage change displayed alongside of it. See how drastically your impressions have risen or fallen, and then you can begin to explore the reasons why.
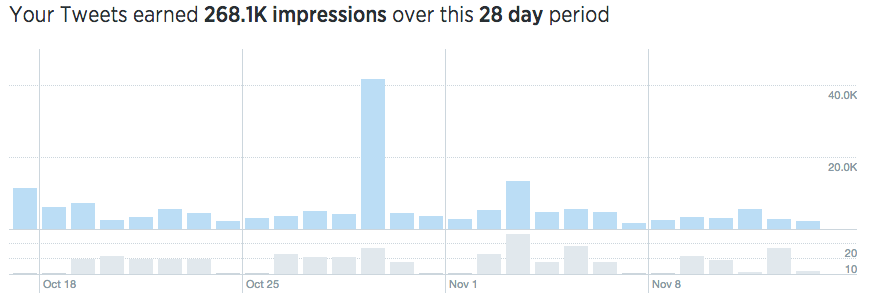
In the rapidly changing social media environment, the second impressions counter is probably the more valuable. Under the Tweets tab, Twitter displays your impressions on a bar graph timeline, showing you how your impressions stack up every single day. The graph presents the number of organic impressions as well as the number of Tweets. This view is fantastic for pinpointing what days your strategy worked well, allowing you to look back on the content and messaging on those days. It also shows you what kind of Tweet volume lead to the most impressions (it isn’t always the most Tweets that mean the most impressions!). This insight, over time, should clearly shape your strategy in terms of what to Tweet, when, and how often.
Engagement rate
Engagement rate is the single most important metric for many social media marketers. Why? Well engagement rate brings together several different metrics into one, giving you a more comprehensive look at how people are interacting with your content. According to Twitter, engagement rate refers to the number of engagements your content receives divided by the number of impressions. Engagements include a number of different interactions with the Tweet, including:
- retweets
- replies
- follows
- likes
- link clicks
- card clicks
- hashtag clicks
- embedded media clicks
- username clicks
- profile photo clicks
- Tweet expansion
By bringing together all these metrics, including many so-called ‘vanity metrics,’ and dividing them by impressions, engagement rate really shows you whether or not your content, and your content strategy, are enough to stop people in their tracks. Twitter engagement rate is also a great directional metric, meaning if your engagement rate is on the rise, your other KPIs will likely follow.
You can find you engagement rate under the Tweets tab on the right hand side of the page. The engagement rate is plotted on a line graph to show you how it has progressed over the last month, day by day. The graph is interactive, so you have hover over plot points and see what your engagement rate was on individual days. Not unlike with impressions, this allows you to see on which days your engagement rate spiked, so you can learn from the content and promotion strategy that worked.
Here at Hootsuite, we’ve been tracking our Twitter engagement rate for quite some time. Following this metric allowed us to actually increase our Twitter engagement rate by 180 percent in just two months using five basic principles. You can find out more about how we achieved that growth here.
Clicks
If you had to pick one metric out of that bulleted list to look at individually, it should probably be clicks. Link clicks are one of the more tangible social media metrics, since they represent a more concrete act on the part of the user—actually leaving Twitter for another website of your choosing.
Clicks are one of the ways in which Twitter helps you to meet your broader business goals, goals that extend far beyond simple brand awareness. Whether you’re driving to a landing page to gather leads or pushing downloads of your app, clicks are how you get there. The best part? You can make sure your links are trackable, so you know how people who click your Tweet navigate through the rest of your web properties and track them along their buyer’s journey. But that’s a topic for another blog post.
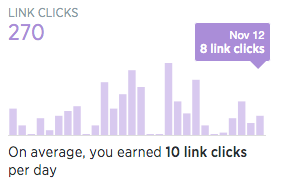
Clicks are also found on the Tweets tab of the Twitter analytics page, directly underneath your engagement rate. Clicks are presented on a bar graph representing the last 28 days so that you can, once again, track your results over time. When you see a spike in clicks, that usually means you’ve shared a particularly compelling piece of content. Find that piece of content, and the messaging you sent, and send them again. Don’t be afraid to repeat Tweets at different times and on different days. The chances of the same people seeing the same messaging are actually quite small. You’re far more likely to expose a great Tweet to a brand new audience.
Audience interests
Social media is about being social, about making a connection with your target audience. Unlike with traditional media, social media users have the control. They decide what they see and what they ignore. As a business, you need to meet people where they are and give them what they want. Twitter provides you with a sure fire way of doing that: audience interests.
Audience interests is an analytics category that presents the popular topics that your followers are talking about or reading about. Twitter gathers information about their interests and highlights those that are shared by a majority of your audience. This information is then presented in a bar graph, showing you both the most common topics and what percentage of your audience is interested in each.
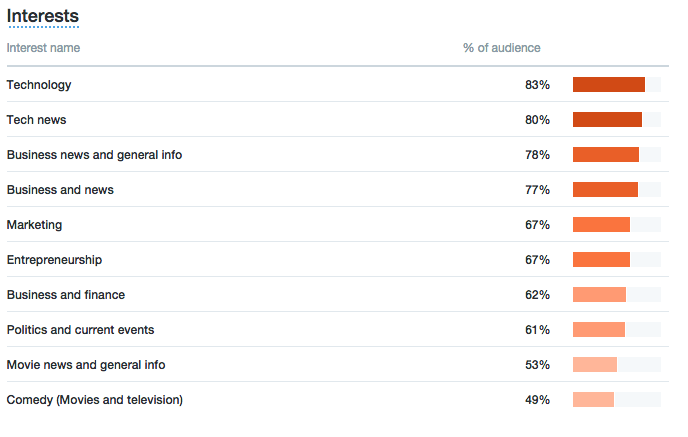
Why is this so valuable? Well, as a brand trying to connect with your audience—and not simply be another company they scroll over in their stream—these interests provide you with topics you know your followers are inclined to talk about. If you can create content that fits these themes, you know there’s a good chance your followers will read it, share it and comment on it. Audience interests is like a wedding registry: you can’t really go wrong by picking something off the list.
Looking at the interests list above (my own), I know that my followers are very interested in technology and tech news, as well as business and marketing. That’s fantastic, because it’s the focus of most of my social media messaging. However, my followers are also very interested in movies, and comedies in particular. That’s an opportunity. If I can someone talk about comedies or film in general through the lens of technology and business, I might have a hit in the making. Something like, “What Step Brothers taught me about how to make people laugh on Twitter,” sounds pretty good to me. (Worth noting: Twitter has an analytics module dedicated entirely to the TV genres your audience is interested in.)
Interests are found in two places under the “Audiences” tab of the analytics page. The same graph can be found under the overview and lifestyle sections. Make sure you regularly check in on your interests, as new common topics will emerge as your following evolves.
Audience country and region
Social media has given every business the opportunity to be a global business. Depending on the size and reach of your company, you may have Twitter followers from across your neighbourhood, your city, your country or even countries around the world.
If you’re going to connect with your audience on a personal level, it’s important that you provide them with content that resonates with them where they are. For that reason, Twitter’s country and region analytics insights are invaluable.
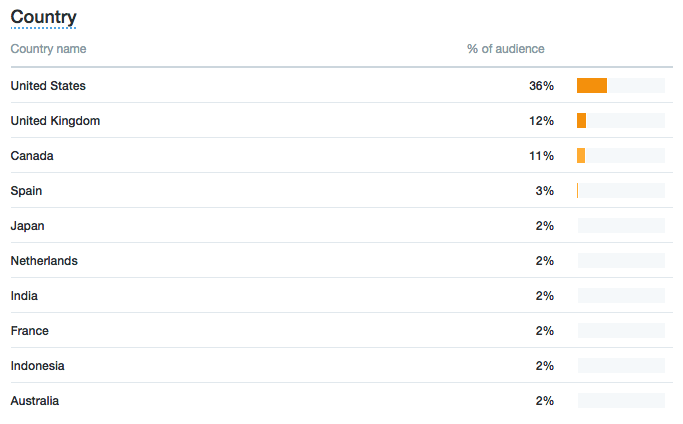
With the countries module, Twitter shows you where the majority of your followers reside across the globe by percentage. This is particularly valuable for large businesses with varied audiences. If you’re making an effort to break into Europe, for example, this module could be a clear indicator of where you’re making progress, and where you might need to put in a bit more work.
This overview of countries is also valuable for content strategy, showing you where the content you post on Twitter is resonating, and where you might need to make an extra effort to localize your blogs, for example. Finally, the country overview could impact your posting schedule. If you have a significant presence or audience in a country with a different timezone, you may want to post content during their prime Twitter hours.
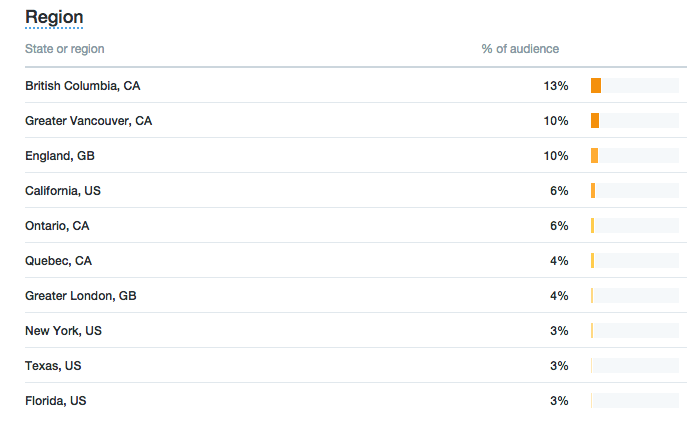
Where countries is valuable for broad insights, the regions module is particularly insightful for local and national businesses or chains. Regions shows you the cities or areas where you’re making an impact. For a local or national business, particularly those trying to use Twitter to drive customers into their doors, this information can help guide your Twitter strategy in several ways.
If I was a Canadian business looking at the chart above, I would see that I’ve earned a solid audience in British Columbia, as well as Ontario and Quebec—the biggest regions in Canada. If I’m trying to get the word out about a new campaign or test a brand advocacy contest, I would probably start in B.C. The Prairies and the Maritimes, however, are absent from the list. This may lead me to increase my Twitter promotion of my stores in Alberta and Manitoba, or possibly localize content I promote for those areas. I might even promote Tweets targeting those regions in particular.
To view both the Country and Region analytics, click on the Demographics tab under Audiences. And, as with most of these analytics, be sure to check in on them regularly as the countries and regions will shift as your audience evolves.
Comparison audience
Every social network has a particular audience, and Twitter is no exception. Twitter users tend to be college graduates, largely in urban areas, with over 50 percent making more than $50,000 per year. There are many more qualities that differentiate Twitter users from, for example, Facebook users or Pinterest users. But you shouldn’t be focused on catering your Twitter efforts to all of the network’s users; you should be focused on catering your Tweets to your own audience. This can be done with the help of Twitter’s Comparison Audience tool.
Comparison audience allows you to compare your followers to the entire Twitter user base or to your organic audience—which includes your followers and the audience you reach through your followers. Both of these options offer valuable insights which can shape your content strategy.
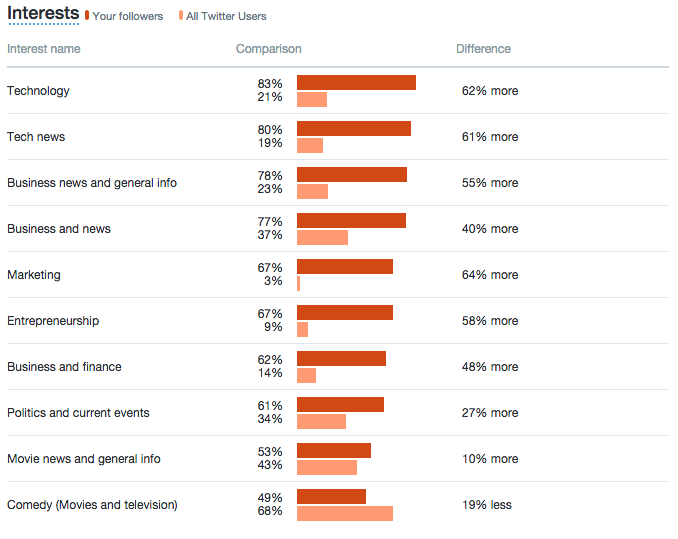
By comparing your audience to the entire Twitter user base, you can very easily see where your audience differs from the broader trends. What are they way more interested in than anyone else? How do their buying trends differ? What about their net worth? Once you’ve identified these differences, you can hone in on them with your content. It is in identifying the outlying qualities of your followers that you’ll able to more effectively connect with them. All day they’re exposed to businesses trying to appeal to as broad an audience as possible. Seeing your efforts to connect specifically with them will help you stand out from the pack.
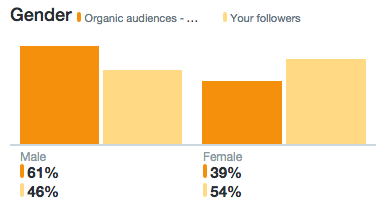
In contrast, comparing your followers to your organic audience will allow you to draw in the followers you don’t yet have. Your organic audience refers to the entire audience you reach, not only your followers. These are the people who are exposed to your content through shares from their contacts, search or other methods. They’ve been exposed to your content, but haven’t followed you, and identifying the differing characteristics might help you figure out why—and eventually earn you that follow. If I run this comparison and see the above chart, I might look into why my campaigns aren’t resonating as strongly with a female audience. Find those differences and work to bring those non-followers onto your team.
Improve your Tweets with the help of Hootsuite!