Google Analytics is most certainly complex, so naturally there are a few options and features that go unnoticed.
So where do you begin if you’re trying to get more advanced and need a place to start? In-Page Analytics is probably one of the most under-used features that can also be the most impactful to a small business.
By looking at these specific analytics you can figure out which areas of your site are most important and which links visitors are clicking when they are actually on your site.
Once you can understand some of the details associated with user patterns, you can reformat your site and optimize in ways that ultimately will boost your conversions.
How to access your In-Page Analytics
The purpose of In-Page Analytics is to be able to tell what is working visually and what is not. In order to see your In-Page Analytics data you will need to sign into your Google Analytics account. Before you can do anything specific with the report, you will have to enter the URL for the page on which you want the report to launch. You enter that URL when you edit the settings for a Reporting view.
You can access this report two ways:
- Access—Way #1
- Sign in to your Analytics account.
- Navigate to your view.
- Select the Reporting tab.
- Select Behavior > In-Page Analytics.
- Access—Way #2
- Select Behavior > Site Content > All Pages.
- Drill into a page and select the In-Page tab.
- This opens the report for that page.
In both cases you access the report through the ‘behavior’ section. Once, you click on In-Page Analytics, your website’s home page will display the exact percentage of where users are clicking on your site. Below shows where you can find the In-Page Analytics report and what it looks like:
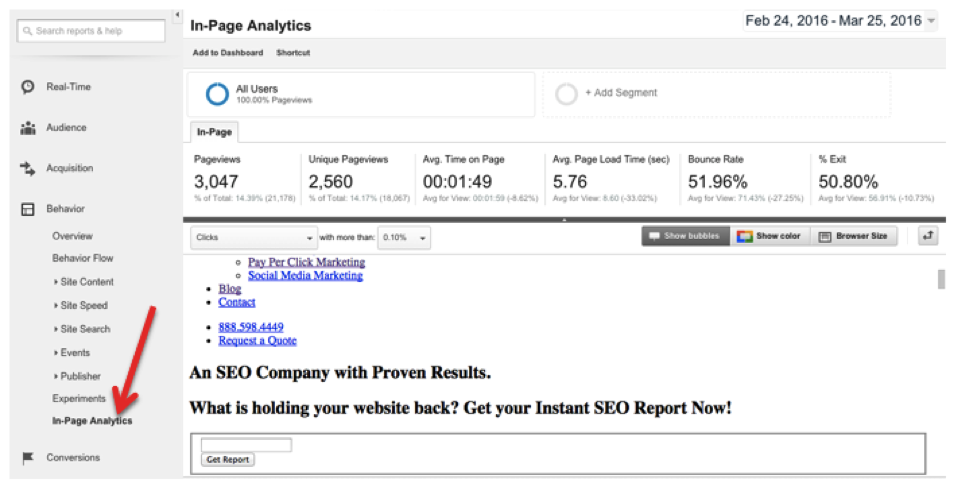
Once again, the job of the In-Page Analytics report is ultimately to infer the number of clicks on a page element (CTA, links, etc.) from the number of times that page appears as the referrer to subsequent pages.
In this way you can see which elements are leading to the more popular subsequent pages on your website. In many cases this is not just a preference of content, but something that stood out more than other elements on your website.
Customizing In-Page Analytics
According to Site Pro News, you can also customize in-page analytics for the needs of your site, which Site Pro News also touched on here. This can directly help to optimize your site, which in turn will help boost conversions.
Here are two ideas for how you can customize the report:
Importance of setting the date range
Just as with any report, you may customize your date range by clicking on the date panel located on the top right-hand side of your analytics dashboard and choosing your own date range.
This will allow you to understand exactly what was up on your site or any changes you have made, and when. Periods of time are incredibly important to consider with this analysis, so I recommend clicking the ‘Compare To’ button to see if you’re making improvements:

Keep in mind that the only way to say whether or not your numbers are ‘good’ or ‘bad’ is to compare them to what they were in previous months, and this is especially true with this report.
Every website is different, so you’re in a competition with yourself first and foremost before worrying about competition.
Using Segmentation
There are a lot ways to segment your data on the in-page analytics platform. This will allow you to look at how users arrive on your site (for example) and then the ways that they navigate it once they are there.
You can separate, as the screen shot indicates, by categories such as ‘made a purchase’, ‘referral traffic’, ‘direct traffic’, or ‘new users’. All of this can be used to optimize your site and figure out what focus you need to have to boost conversion rates.
To create a segment, click on All Users. This will take you to a screen where you can ‘Add a Segment’ (as shown below). You can then click to create a recommended segment or create a custom one. The screenshot below, for example, has segments for Bounced Sessions, Direct Traffic, and Converters. Just hit ‘Apply’ at the bottom when you’re finished.

Note: If you’re new to segmentation, segmenting your email lists is probably one of the easiest and most important places to start. Check out this article to learn more.
Making the Most of In-Page Analytics for Conversion Rates
Just as we discussed above in the section on data customization, there are a lot of different ways to make the most of your data to enhance your conversion rates. Segmenting data is one of the more successful ways to focus on who is finding your site and how these differences might effect interaction.
If you are interested, check this out this video on the visual context for your In-Page Analytics data from Google…
So now that you know how to read the data and what to look for, it’s important to understand how exactly to customize it. Below are some tips on customization that will help you make the most of your data for conversion rates:
- Make sure you segment or have a category for each of the streams/referral sites that people may be coming from—whether it be social media or other sites.
- For each channel, you want to construct a separate report (this includes direct traffic as well). This will give a clearer picture of the differences in where your audiences are coming from.
- Make adjustments as you see fit. For example, if you have a CTA that is either not being clicked, or people are leaving your site once they do, then you probably need to readjust and reconfigure the way this particular element is presented. There may also be differences for certain audiences that you want to account for, but remember to prioritize places where you are getting the most traffic from.
- Find out where maximum click happens. For example, if it happens on the top left side of the page, then put your conversion links there. Always check this when you run your analysis and make sure you adjust accordingly, as this can change over time.
- Make efforts to reduce whenever exit rate is high, especially when it is on most-linked or top pages on your site.
- Make it a goal to check back on a regular basis, as you do with your other analytics, so you are conscious of what needs to be adjusted over time
The Takeaway
It is difficult to understand why In-Page Analytics are as underused as they are when they provide such valuable insight. Definitely do not miss out on the opportunity to look at this as a tool of change and boosting conversion rates. The ability to segment your visitors and see how they interact with your site is very valuable; so start now!
Do you have experience with Google’s In-Page Analytics? Let us know in the comments section below, we would love to hear from you.
Related reading
Google has redesigned AdWords: what does this mean for you?
The world, the ad market, and Google itself have all changed dramatically in the past 15 years, and it’s fair to say that AdWords is beginning to show it’s age.

Six tips on measurement from the IAB Programmatic Marketplace
Not getting too complicated with metrics is just one important point covered in an IAB conference session all about attribution.